- September 12, 2023
- Posted by: Amit Pabari
- Category: Uncategorized
Agriculture remains a key driver of gold demand in India, and Rural India, where approximately 65% of the population resides is heavily dependent on agriculture.
By Amit Pabari
One might think that the past year has been dull for the gold bulls as post touching its all-time high of $2070/oz in March 2022, the Gold took a plunge to nearly $1600/oz by Nov 2022, before it again moved past $1900/oz.
Well, getting a closer look, the reality of the trend of the Bullion is quite different as the bullion is setting up its base to fly.
Central banks hoarding gold
There is a trend of decreasing reliance on the US dollar in global reserves, as an emerging market and developing economy central banks diversify their currency holdings, especially post-Russia-Ukraine war, driven by geopolitical and geo-economic factors. Interestingly, since then in the last 18 months, the Central Banks’ gold buying spree gained momentum.
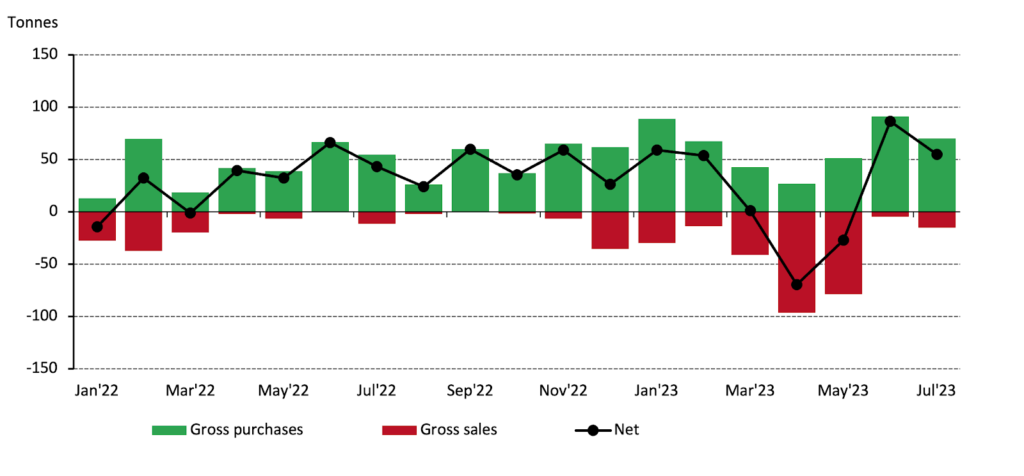
The central banks globally increased their gold reserves by 387 tonnes of gold — the highest purchase in the first half of 2023 since 2000. Leading the pack, the People’s Bank of China added 103 tonnes, Singapore’s Monetary Authority added 73 tonnes, and the National Bank of Poland acquired 48 tonnes. India’s Reserve Bank too bought, and its gold reserves increased to 794.64 metric tonnes in fiscal 2023, a nearly 5% rise from the 760.42 metric tonnes held in fiscal 2022.
Fed’s Stance v/s Gold
Interest rates and gold prices have a complex relationship and are influenced by factors like investor sentiment, inflation, and the global economy. The trajectory of gold prices is expected to trend upward when interest rates stop climbing, and the resilience of the US dollar starts to weaken. Typically, gold is a hedge against inflation and uncertainty. Well, even though the global inflation trend is falling after peaking last year, the expectation is that low growth will persist in the global economy for the next few years.
The growth in major economies like the UK, Euro-Zone, China, and to an extent the US has begun to hurt amid a rise in rates. Gold tends to shine during times of economic uncertainty, including recessions, as it’s widely recognized as a dependable store of value. Therefore, as the current Fed rates are near to peak and moving on, down the line next 8-10 months, the Fed might opt for cuts, which would be seen as supportive or bullish for gold prices.
Anomaly between the US Election and Gold
US elections that happened post the year 2000, have shown a peculiar relationship with the Gold. For the yellow metal, the election isn’t about the blue v/s red war between the Democrats and Republicans.
As seen in the table below, US elections have taken place 5 times in the past 20 years. Gold has significantly rallied 4 times a year preceding the Election year, irrespective of whether the Republicans or Democrats won the same, 2015 was an exception year.
One reason could be that global investors, who have been concerned and increasing their cash holdings, are likely to find more certainty with gold serving as an economic barometer from being merely a tradable commodity.
Domestic demand – Festive and Wedding season
Weddings, festivals, and agriculture majorly drive gold demand in India as in the Indian culture, purchases are often driven by tradition. Festivals account for 65-70% of gold purchases where Diwali and Akshaya Tritiya are particularly auspicious times to buy gold in India, and on average, about 40-60 tons of gold are sold during these two occasions alone.
Further, agriculture remains a key driver of gold demand in India, and Rural India, where approximately 65% of the population resides is heavily dependent on agriculture. Gold demand in rural areas typically surges after the harvest season, which occurs from September to November.

As shown in the heatmap above, the wedding season, harvests, and festivals combined have concentrated in two periods: April to June, and September to January.
Technical Aspect:
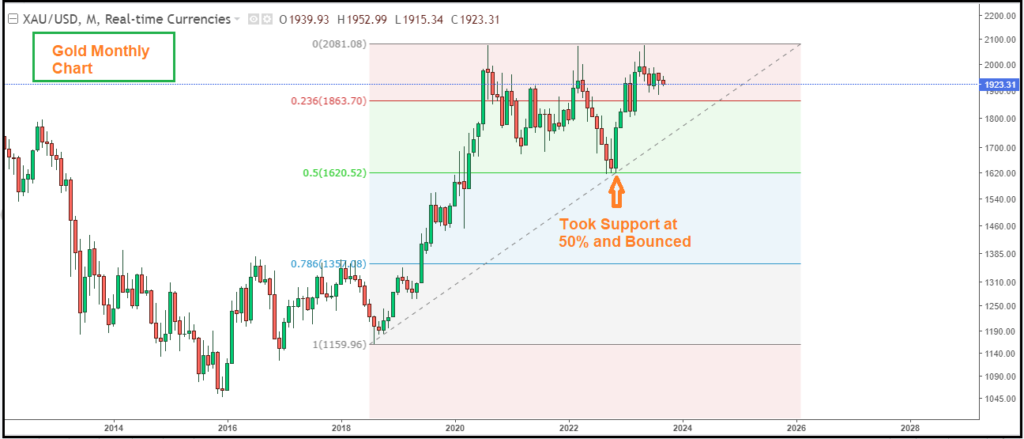
In 2018, it was at $1200/oz, but since then, it’s been in a strong bull market and seems to remain the same up till today. While there was a dip in 2022 due to Fed rate hikes, it didn’t drop to the low of 2015 at $1050/oz or in 2018 at $1200/oz. After taking support around $1600/oz, the yellow metal was on its march towards the north. Hence, we can say that the move is not a bear market price action as in a true bear market, the gold price would fall more than 50%, as it did from 2011 to 2015 (If the asset value retraces/falls more than 50%, it enters the bearish trend). This time it was a typical action of a sharp correction within a gold bull market post which gold began to rise again.
Outlook:
Considering the factors stated above, the overall trend for gold remains bullish internationally as well as domestically. Well, on the international front, a crucial resistance of $2070/oz will be needed to break, post which the rally could continue towards $2150 and $2300 in the horizon of the next 1-2 years. Well, the support of $1600 would be a crucial stop-loss level for a bigger target.
In INR terms, MCX gold which is around INR 59,000 presently is likely to rise to INR 62,000 and INR 65,000 eventually. However, a stop loss of INR 56,000 would be crucial to watch.
Amit Pabari is Managing Director at CR Forex Advisors. The views expressed in this article is his personal views.
Source: https://shorturl.at/elN08