
- February 23, 2024
- Posted by: Amit Pabari
- Category: Uncategorized

It’s all about inflation everywhere and from the race to inflation to race to deflation amongst various countries, it has contributed heavily to shaping the currency dynamics. To understand inflationary/deflationary trends, it’s important to understand the historical causes of inflation, its components, and the measures taken.
Factors contributing to inflation:
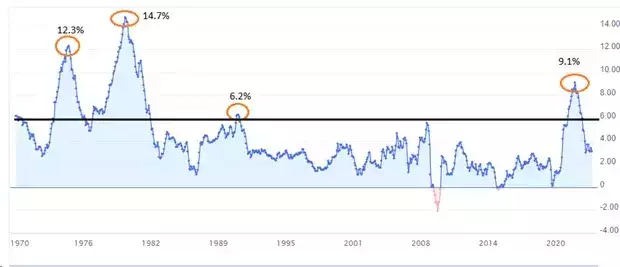
In 1975, inflation in the US was fueled by high government spending on the Vietnam War, soaring oil prices due to OPEC’s actions, a wage-price spiral driven by strong labor unions demanding higher wages, and loose monetary policy.
The Federal Reserve responded with a tight monetary policy, raising interest rates to nearly 8% to reduce money supply growth, while the government implemented fiscal measures to reduce spending and budget deficits.
In 1980, inflation was driven by high oil prices due to geopolitical tensions in the Middle East (Iran-Iraq War), high government spending on defense, and expansionary monetary policy in the 1970s.
To control inflation, the Federal Reserve raised interest rates to above 20%, and the government introduced fiscal restraint by cutting spending and reducing budget deficits.
In 1990, rising oil prices due to the Gulf War and geopolitical tensions, increased consumer demand leading to demand-pull inflation, a weakening dollar leading to higher import prices, and high government spending on defense and social programs contributed to inflation.
The Federal Reserve tightened monetary policy by raising interest rates to nearly 9%, and the government pursued fiscal austerity measures by reducing spending and budget deficits.
In 2022, inflation was fueled by supply chain disruptions due to the COVID-19 pandemic followed by the Russia-Ukraine war, pent-up consumer demand post-lockdowns, increased commodity prices, and expansionary fiscal and monetary policies to combat pandemic effects. To control inflation, the Fed yet again raised rates to 9.1% and carried out quantitative tightening to curb inflationary pressures.
As seen, war was a major reason for inflation to spike abnormally, and to control the same, the Fed followed its age-old tradition of raising interest rates. Well, ironically, whenever the inflation crossed the 6% – mark, the Fed’s interest rates increased above 6% except in 2023. However, what remained unchanged is the matrices to gauge the US Fed inflation back in the 1970s and 2024, though the weightage could differ.
Well, the weightage matters as the same can gauge the future inflationary trends that would eventually determine the Fed’s path and the fate of currencies.
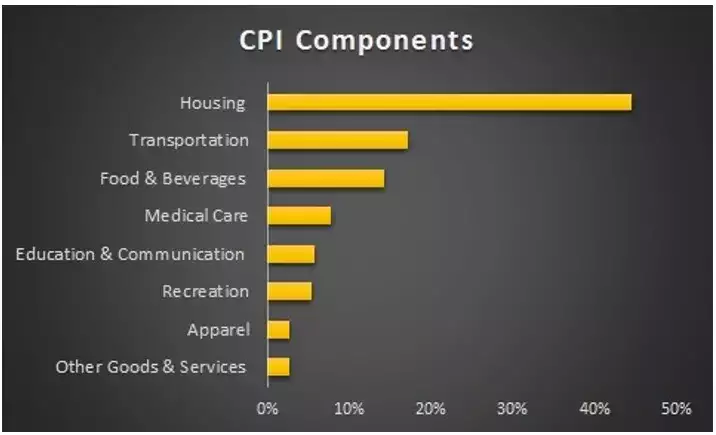
As seen, the highest weightage in the US basket of inflation is Housing which comprises nearly 45% followed by transportation which contributes 17%, driving to a whopping 62% of the overall basket weightage. This explains why changes in shelter costs, gasoline prices, or food prices significantly impact overall inflation.
Further to subcategorize, Gas utilities, Fuel oil, Electricity, and Shelter come under the “housing category”; Gasoline, Used cars, and New cars are categorized in “Transportation.”
However, in the latest inflationary wave, the highest inflation was in the Gas Utilities, Fuel Oil, and Gasoline as seen in the table below which had risen by around 38%, 98%, and 60% respectively in June 2022. Since then, till now, the prices have fallen significantly by 146%, 114%, and 111% respectively. Further, the Food inflation has also fallen significantly.
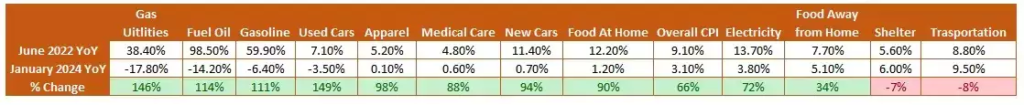
Prices in all the segments have fallen except Shelter and Transportation that have shown a rise by 7% and 8% respectively from 2022 till Jan 2024.
However, one may argue that despite inflation falling across, how come the shelter and transportation have shown a surge?
This is because the housing or shelter category remains the last one to react to the Fed’s rate due to below reasons:
• Contractual Agreements: Many rental agreements and mortgage contracts have fixed terms, often lasting one year or more. As a result, changes in interest rates may not immediately affect the monthly housing costs for renters or homeowners .
• Adjustment Periods: Even for adjustable-rate mortgages or rental contracts with periodic adjustments, there may be a lag between the Fed’s rate hike and the adjustment period for these contracts to reflect the new rates.
• Market Dynamics: Housing markets may have inertia, meaning it takes time for changes in interest rates to influence housing supply and demand dynamics, which in turn affect rental and housing prices.
• Consumer Behavior: Renters and homeowners may not immediately react to changes in interest rates by adjusting their housing choices or spending patterns. For example, homeowners may not rush to refinance their mortgages immediately after a Fed rate hike.
• Data Collection and Reporting: Shelter inflation data, is typically collected and reported with a lag. It takes time for statistical agencies like the Bureau of Labor Statistics (BLS) to collect, process, and publish inflation data, which contributes to the observed lag in the transmission of Fed rate hikes to shelter inflation.
While for Transportation:
The transmission of a Fed rate hike to transportation inflation is typically seen with a lag for several reasons:
• Contracts and Agreements: Many transportation-related contracts, such as those for shipping or leasing vehicles, are often set for periods ranging from several months to several years. These contracts may have fixed rates that do not immediately reflect changes in interest rates.
• Cost Pass-Through: Transportation companies may not immediately pass on increased borrowing costs to consumers in the form of higher prices. Instead, they may absorb some of the increased costs temporarily to maintain competitiveness in the market. It may take some time for these companies to adjust their pricing strategies and pass on the increased costs to consumers, contributing to a lag in the transmission of Fed rate hikes to transportation inflation.
• Inventory and Supply Chains: Transportation costs are also influenced by factors such as inventory levels, supply chain dynamics, and fuel prices, which can fluctuate independently of changes in interest rates. These factors can create noise or mask the direct impact of Fed rate hikes on transportation inflation in the short term.
Hence the inflation in these two segments has shown lag and contributed to the overall CPI basket remaining above the Fed’s 2% target.
As recently, Shelter CPI has now moved down on a YoY basis for 10 straight months, from a peak of 8.2% in March 2023 (highest since 1982) to 6.0% today. Given its long lag vs. real-time rent data, a continued move lower is expected which should lead to a continued decline in core and headline inflation.
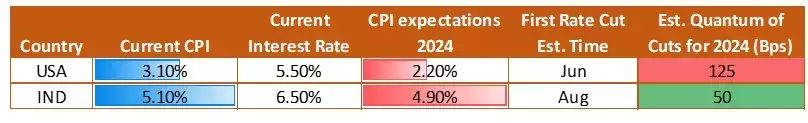
This week we saw the Inflation data of India and the US released. On Monday the India inflation data released was higher than expected at 5.10% but lower than the previous month. The mild upside surprise on CPI inflation has come on the back of higher-than-expected food inflation.
Even with this mild rise, consumer price inflation remains within the central bank’s tolerance band of around 4% for the fifth straight month, keeping the RBI firmly Hawkish for the right reasons.
Further looking at the latest US inflation data, which was stronger-than-expected and came in at 3.1%, blew the markets, and the rate cut expectations were pushed back to the June policy from earlier discounted March and May cuts.
However, despite all the narrative around inflation, US inflation and its expectations going forward remain lower coupled with the largest cuts anticipated by the Fed as compared to RBI.
Outlook on the Rupee
Summing up the above case, lesser rate cuts from RBI v/s the Fed would lead to a favorable interest rate differential for India, keeping the Rupee supported and the dollar index could plunge towards 103-102.50 levels with limited upside towards the 106-107 mark.
Followed by India’s robust domestic fundamentals, the strong growth trajectory of Indian corporations, and investor confidence, the Rupee seems to be trailing behind in its current value.
As the Rupee aligns itself with these solid fundamentals, the rise in the rupee could begin. Currently, the Rupee seems poised for gains, buoyed by robust inflows due to the MSCI rebalancing and active intervention by the Reserve Bank of India (RBI).
Overall, as the flows start hitting the market and once the currency pair breaches the 82.80 mark, it is likely to move toward the 82.50 level. On the flip side, the robust resistance at 83.25-83.40 seems to remain protected for the medium term (3-4 months).
(The author is MD, CR Forex Advisors)
Amit Pabari is a managing director ar CR Forex Pvt Ltd. The views expressed in this article are his personal views.
Source: https://shorturl.at/foGI8