- July 19, 2022
- Posted by: Amit Pabari
- Category: Uncategorized

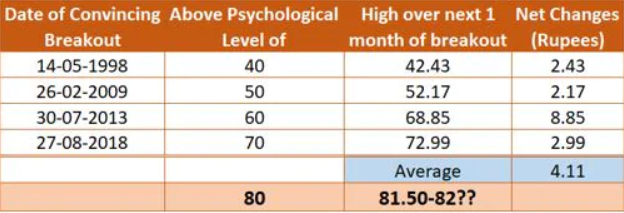
The rupee hit the 80 mark against the US dollar for the first time on Tuesday, having hovered close to it for the past few sessions. In the past, whenever the Indian currency has reached a psychologically important level, it has seen wild moves for the next one month or so.
Here’s a look at a few such instances in the past:

Current scenario supporting the given base case
If we observe closely, when the currency has broken above a given big mark, those years have had some major significant events.
Like 1998 was a year of an Asian currency crisis, 2009 is known as GFC (Global Financial Crisis), 2013 was linked with Taper Tantrum, and 2018 was a year of Trade war (US had imposed tariffs on Chinese products). So, 2022 could be captioned as ‘Global Stagflation Time’ (GST).
Factors that have been in favour of rupee’s sharp depreciation are FII’s withdrawal, higher inflation, gloomy demand outlook due to recessionary fear and Fed’s aggressive tightening.
Against these backdrops, Reserve Bank of India (RBI) has tried well to curb the moves by liberalising forex policy and allowing rupee invoicing. But this doesn’t seem to favour in the short term. That apart, it also tried intervening through spot, forwards, and futures but that didn’t help much.
We are seeing contained volatility during interbank timings. But rupee has been showing a gap up opening on a negative side in recent time. Even a sharp fall in oil prices from $115 to $95 hasn’t helped India much, which is reliable on imports for 85 percent of its oil consumption.
Under the given scenario, it is very much likely that the rupee could show some big sharp move on a depreciating side over the next 30 days.
Tactical and technical bias

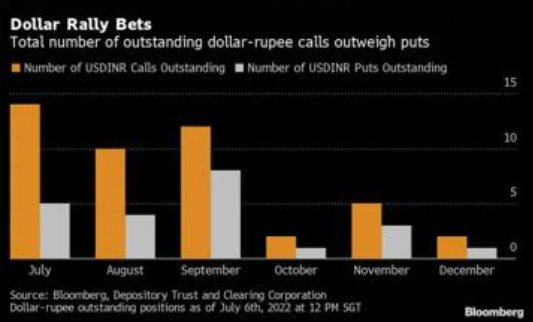
The volatility skew analysis suggests that traders are continuing to buy dollar-rupee call options at much higher premiums relative to puts (orange bars are higher than grey bar).
The given option setups are currently priced with 52 percent of 82 levels by year-end, which would increase this year’s decline to almost 10 percent, making it the worst year since Taper Tantrum year 2013.
That apart, on breaking 80 levels, many traders will trigger their stop losses and short carry could be exaggerated.
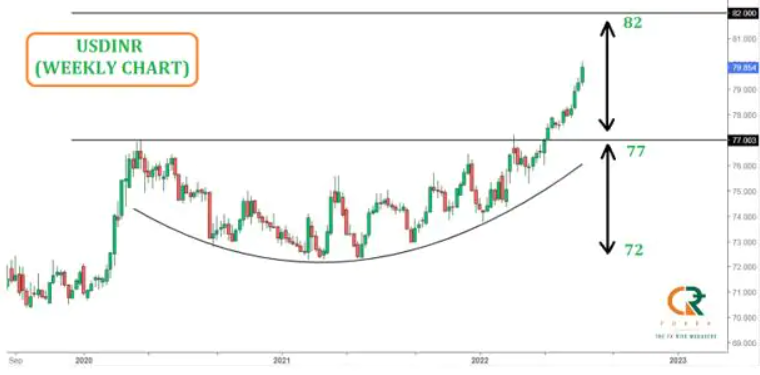
Technically, the pair has given a breakout from a ‘Rounding Bottom pattern’ neckline above 77, and it is setting a target of 82 levels. Usually, this pattern forms at major reversal and near the bottom, but in this case, it has formed in the middle of the bull trend.

Outlook
Apart from given fundamental headwinds like FII’s withdrawal, gloomy demand outlook due to recessionary fear, and Fed’s aggressive tightening; historical analysis of USDINR suggests that there could be a sharp jump in USDINR if it convincingly crosses the 80 mark. With a conservative view, it could move towards 81.50 to 82 levels over the short term, where the rounding pattern target also coincides. On the flip side, 79.30 and 78.90 will be crucial support levels.
—Amit Pabari is Managing Director at CR Forex Advisors. The views expressed in this article is his own.
Source : https://tinyurl.com/yckr58xh


